
New · Topology Builder & Viewer
Network topology built from real data, not drawings
Slurp'it builds the topology from the data it already collects: LLDP, CDP, ARP and routing tables. Zoom in on thousands of devices, find what hangs on a device, trace a path from A to B, and pull it all through the API for correlation and automation.
LLDP · CDP · ARP · routingmapped out of the box, extend with OSPF, BGP or your own data
Path tracingA to B, hop by hop, with interfaces. Export to PNG for the ticket
API & MCPquery topology by hostname, date or vendor, as JSON
Diagrams go stale. Collected data doesn't.
A drawn diagram is out of date as soon as the network changes. Slurp'it builds the map from what it collects, so it changes when the network does.
Slurp'it doesn't draw. It builds.
Slurp'it already collects LLDP and CDP neighbours, ARP tables, routing tables and interfaces from 180+ vendors. The Topology Builder turns that data into links; the Viewer turns the links into a map.
When the network changes, the map changes.
Every collection updates the topology. Add a switch, move an uplink, retire a router: the next run shows it. And because the data is historical, you can look back at how it was last week.
You decide what a link is.
Out of the box Slurp'it maps on ARP, LLDP, CDP and the routing table. Running OSPF or BGP, no neighbour protocols, or a design of your own? Define the mapping yourself, on any data Slurp'it collects.
See it in action
Three videos: the two-minute overview, the full tour of the Viewer, and how to build your own mapping.
Video 1 · 2 min
Topology in two minutes
How collected data becomes a map: colour links by source, switch sources on and off, search any device and see what it's connected to, and scale from a sandbox to a service provider with 18,000 devices.
- Builder: combine any planning and attribute into topology logic
- Viewer: colour per link type, deduplicate links, show or hide sources
- Search a device and see its neighbours
- Everything available via the API, filtered by planning or hostname
Video 2 · 6 min
Using the Viewer: filters, path tracing, export, sessions
Show or hide redundant links, switch between routing and LLDP to see how the network behaves when a connection falls away, export a view or a traced path to PNG, filter live, and save sessions for your team.
- Live switching between routing, LLDP, CDP and ARP
- PNG export of the map or a traced path, for tickets and HLD/LLD documents
- Path tracing with “show paths only”
- Filter on the fly; hide non-matching items
- Save sessions, private or shared with the team
- Historical: see how topology changed over days
- Query via API or MCP by hostname, date or vendor
Video 3 · 7 min
Building your own mapping
For engineers who want more than the defaults. Pick a planning, define source and target, match on hostname or IP, link layer 2 by interface or layer 3 by IP or network, and decide whether unknown devices appear on the map.
- Default mappings: ARP, LLDP, CDP, routing table
- Source = inventory device (hostname, IP, FQDN); target = collected neighbour data
- Layer 2: interface to interface. Layer 3: IP to IP or IP to network
- Include unknown devices per planning; show nameless devices by IP
- Colour and enable/disable per planning; changes show in the Viewer immediately
What you can do with it
All of this is built from data Slurp'it already collects. No agents, no drawing.
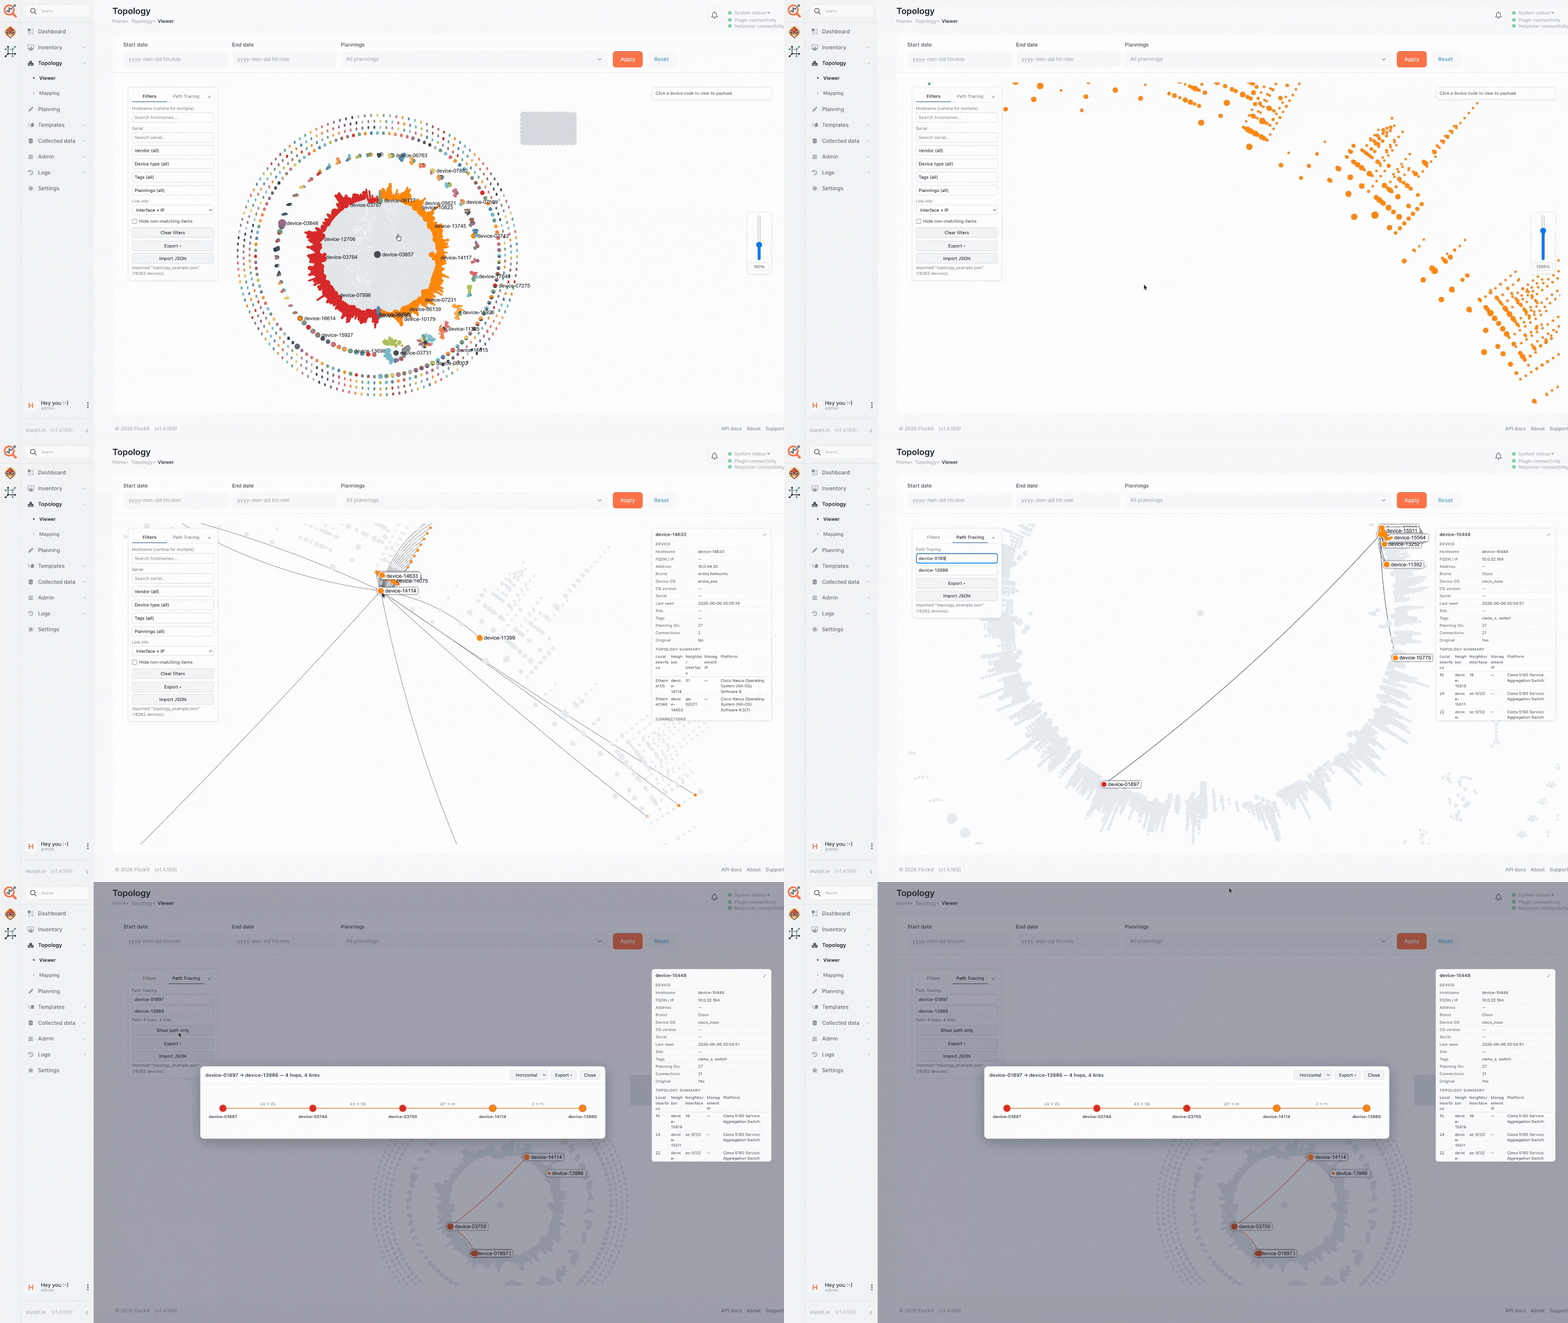
Thousands of devices in one view, positioned automatically even without sites or hierarchy. Zoom in like a map, to a site, a rack or a single device.
Search a hostname and the map zooms to it with everything it's connected to. Filter live on vendor, tag or site to see which devices live where.
Pick two devices and see every hop and interface between them, built from collected data. Show only the path, export it, put it in the ticket.
When one device fails, every neighbour raises an alarm and the ticket queue fills up. With the topology relations, your monitoring, ticketing or AI can see they all point to the same device, and raise one ticket instead of fifty.
VRF-aware views show connections where they actually live, not flattened into one graph.
Switch LLDP, CDP, ARP and routing on and off, colour each source, and add your own mappings on OSPF, BGP, tunnels or anything else Slurp'it collects.
PNG export of any view or traced path for tickets and design documents. Save a session, private or shared with the team, and restore it later exactly as you left it.
Topology data is historical. See how the map looked last week and what changed since.
Query topology through the REST API or the MCP server by hostname, date or vendor. JSON back, ready for automation or an LLM.
How it works
Slurp'it stores collected data per planning. A mapping tells the Builder how that data becomes links. It has four parts.
Planning
Which collected data set to build from: the LLDP planning, the routing table, or a planning you created with your own TextFSM template.
Source
The device in your inventory. Slurp'it knows it by hostname, IP and FQDN, so a match works whichever one the data contains.
Target
The neighbour as it appears in the collected data, matched on hostname or IP. Devices that are not in your inventory can be shown as unknown, or by IP alone.
Link type
Layer 2: source interface to target interface. Layer 3: IP to IP, or IP to network. Each planning gets its own colour and can be switched on or off.
Per planning you decide
- whether devices that are not in your inventory appear on the map, and whether nameless devices are shown by IP
- the colour of its links in the Viewer
- whether the planning is active (routing-table mappings cost more on large prefixes)
Changes are processed in the back end and appear in the Viewer within seconds. The 18,000-device example network in the videos loads in the browser without pre-aggregation.
Default mappings: ARP, LLDP, CDP and routing table. Extend them when you need OSPF, BGP or custom relations.
Questions engineers ask us
Does Slurp'it draw topology from LLDP and CDP only?
No. Out of the box it maps on ARP, LLDP, CDP and the routing table. You can add OSPF, BGP, tunnels or any other data Slurp'it collects, and define your own relations.
Is it VRF-aware?
Yes. Links are shown in their VRF context, so devices that appear in several logical paths are not flattened into one graph.
Can I export a diagram for a ticket or a design document?
Yes. Any view or traced path exports to PNG. The export shows what is on screen, so zoom to what you want to share first.
Can other tools or an AI assistant use the topology?
Yes. The REST API and the MCP server return topology for a hostname, date range or vendor as JSON: connected devices, links and interfaces.
Is Topology included in Foundation?
Topology Builder & Viewer is an add-on. You can try it in the sandbox.
How many devices can the Topology Viewer handle?
The example network in the videos has 18,000 devices and loads in the browser without pre-aggregation. You can filter live and zoom from the whole network to a single device.
Can I trace a path between two devices?
Yes. Pick a source and a destination and Slurp'it shows every hop and interface between them, built from collected data. “Show paths only” hides everything else; the result can be exported.
What about devices that are not in my inventory?
Per planning you choose whether unknown neighbours (a supplier's device, a customer router, an endpoint) appear on the map. Devices without a hostname can be shown by IP.
Can topology help with incident correlation?
Yes. When one device fails, its neighbours alarm too. Because Slurp'it knows the relations, your monitoring, ticketing or AI assistant can query the topology via the API and group those alarms under the device that actually failed.
Try it on your own network
Topology Builder & Viewer is an add-on. Start in the sandbox, or book 30 minutes and we'll run it on your data.
Also see: Slurp'it product overview · NetBox plugin · Pricing