Slurp'it is an agentless network discovery and inventory tool that finds every device in your network, collects data from 180+ vendors, and keeps NetBox, Nautobot and Netpicker in sync with your live network. This article explains how to turn discovery, collection, parsing, relationships and refresh cycles into a usable, current network inventory.
A scan that returns IP addresses is only the start. First, a team must identify each device. Next, it must collect the device state. Finally, it must map how the device relates to the rest of the network. The useful workflow is discover, collect, parse, relate, refresh, and deliver.
What network discovery should produce
A useful result is a living inventory, not a one-time spreadsheet. Each device record needs a stable identity, useful fields, a collection time, and enough context for action. These fields can include hostname, management address, vendor, platform, software version, interfaces, VLANs, routes, hardware parts, and neighbor data.
Current data matters as much as full coverage. For example, a detailed record from months ago can mislead an engineer during an outage. By contrast, a smaller set of fresh fields may be more useful than a large dataset with no update policy.
| Discovery stage | What it produces | What teams can do with it |
|---|---|---|
| Reachability scan | Responding addresses | Find possible devices to inspect |
| Device discovery | Known devices and basic facts | Create an initial inventory |
| Structured collection | Standard fields from CLI output | Search, filter, report, and compare |
| Relationship mapping | Interfaces, neighbors, nodes, and links | View topology and trace links |
| Continuous inventory | Planned collections and past snapshots | Track change and feed automation |
The network discovery data flow
Useful network discovery is a data flow. Each stage affects the quality of the final inventory.
1. Find and identify devices
First, define the scope. List sites, subnets, segments, management networks, and ranges that must be left out. In a segmented network, discovery must reach each target zone. Do not assume that one scanner can see every device.
Slurp'it supports manual device entry, API input, bulk upload, and automated discovery. Its automated finder uses SNMP, and it supports segmented networks. Therefore, teams can mix methods instead of forcing every site into one process. See the Slurp'it product workflow for device discovery and collection.
Make the scope clear. Record which ranges were tried, which access profiles apply, and which zones are left out on purpose. Otherwise, a clean inventory may hide major gaps.
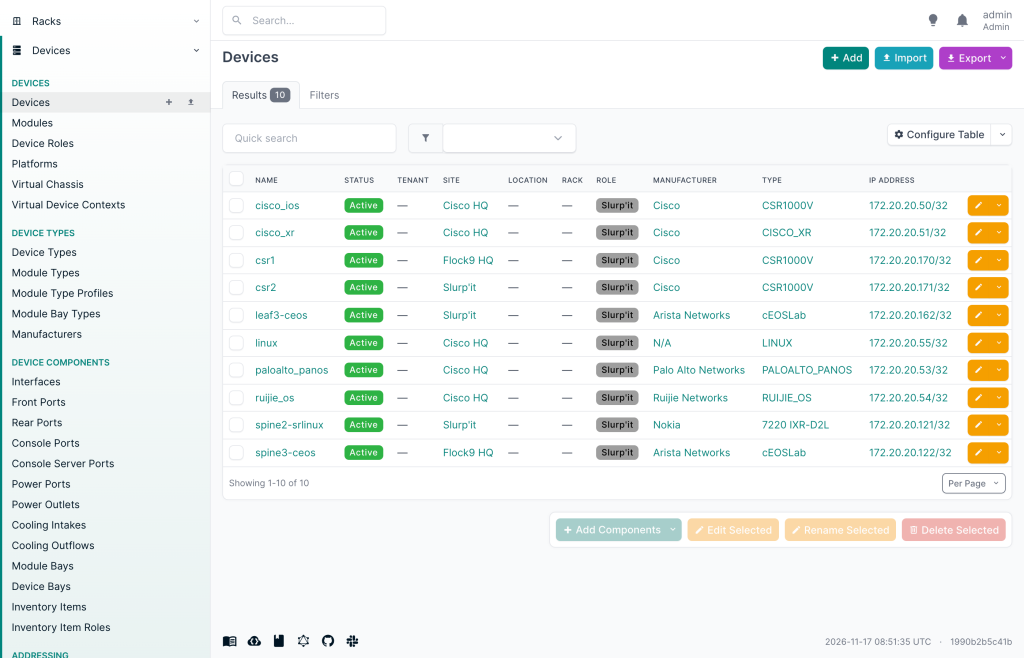
2. Collect the data you need
Finding a switch does not reveal enough to run it. Next, collect data from the device, often through show commands in its CLI. The right command set depends on the goal.
- Inventory: collect platform, software, chassis, module, and interface facts.
- Troubleshooting: collect interface state, neighbor, route, VLAN, and protocol data tied to common faults.
- Automation: collect fields used for checks, target choice, or later steps.
- Topology: collect neighbor and interface data that can form nodes and links.
Do not collect every command just because it exists. More raw output adds storage and work but may add little value. Instead, start with the questions the inventory must answer. Then map each question to a command and update rate.
Slurp'it is agentless: it collects network data over SSH and APIs without installing agents on devices. Teams can choose what to collect and how often, using support for 180+ vendors and 1,800+ community TextFSM templates.
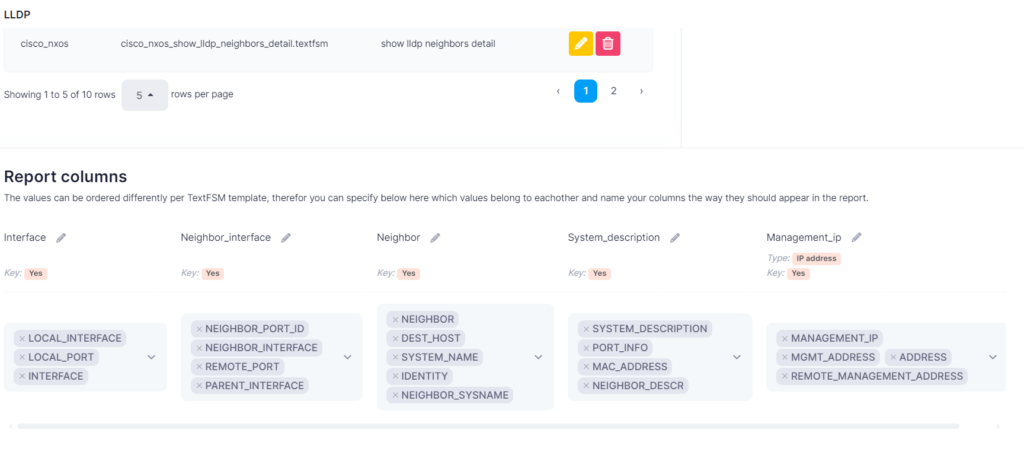
3. Parse CLI output into structured records
Raw CLI text is clear to an engineer but hard for tools to use. Formats vary by vendor, platform, software release, and command. As a result, a script that reads text at a fixed position can fail when a header changes or a field is missing.
Parsing turns the output into fields and rows. For example, an interface command can become rows with interface name, admin state, live state, description, address, and other facts. Then a team can find every down interface, compare two snapshots, or request data through an API without parsing the CLI again.
TextFSM uses templates to pull fields from semi-structured command output. However, successful parsing is not enough. Field names must also be stable across vendors when teams need to compare them. Slurp'it includes ready-made templates and supports building and testing TextFSM add-ons.
4. Add relationships to network discovery
An inventory answers “what exists.” A relationship model adds “how it connects.” Interfaces, neighbor facts, VRFs, and other fields can link devices in a topology. This context is far more useful during fault finding.
For example, an engineer may need to inspect a failed path. A flat list gives possible endpoints. By contrast, interface and neighbor links can show the relevant path and where it changed. The same links can support impact checks before maintenance or provide context to another tool through an API.
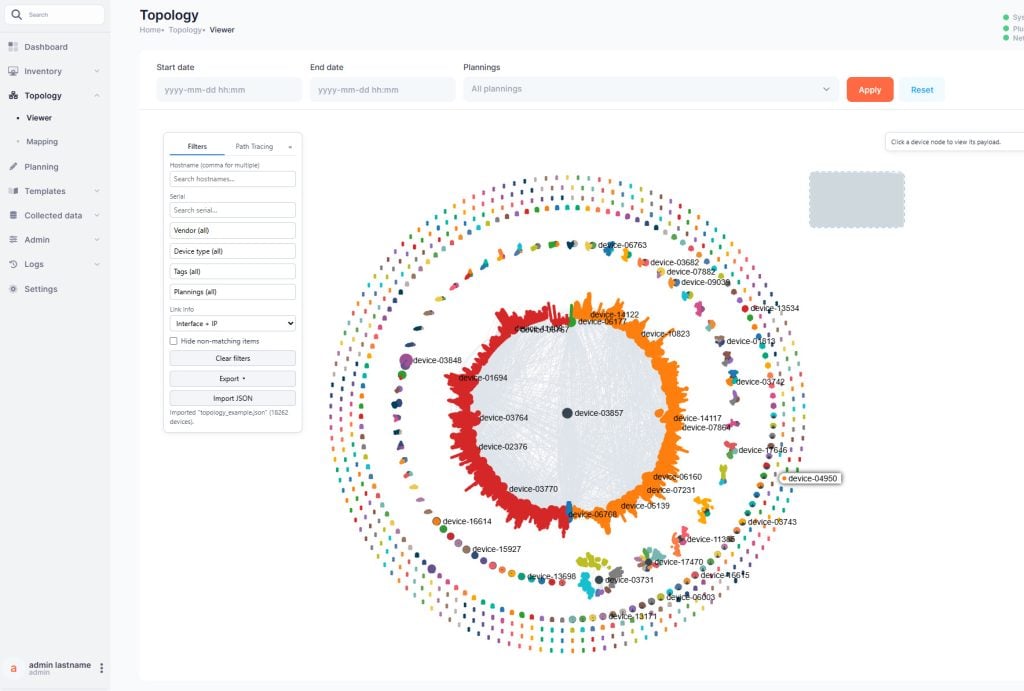
Topology Builder & Viewer is a licensed add-on that builds live topology from data Slurp'it already collects. It supports path tracing, while topology data is also available through the REST API and MCP server.
5. Refresh data based on change rate
There is no single correct update rate. Device identity may stay the same for a long time. Interface or neighbor state can change much faster. Therefore, one schedule for all commands either adds needless load or leaves key facts stale.
Set a freshness goal for each dataset:
- How fast must a change appear?
- What is the cost of stale data during a fault?
- How much load can the device and network handle?
- Does the next tool need the latest state or a daily base line?
Also, store the collection time with the result. “Interface is down” is incomplete without “seen at this time.” Past collections then help teams tell a long-term fault from a new change.
How network discovery supports daily work
Inventory that teams can query
Structured inventory turns questions into filters rather than manual checks. For example, teams can group devices by vendor, find a software version, inspect interfaces, export a report, or send selected records to another system.
Slurp'it provides generated views, custom reports, exports, and past collections. Its REST API can get data for one host, get data by planning and hostname, compare snapshots, and schedule collections. Therefore, both people and other tools can use the same inventory.
Fault finding with current and past context
During an outage, teams need more than a device name. They need current interface and neighbor state, useful links, and signs of what changed. Structured records reduce the need to log in to many devices and read each output by hand.
History adds more context. If a route, neighbor, module, or interface field differs from an older collection, the change can narrow the search. It does not prove the cause, but it gives responders a clear before-and-after view.
Automation based on known state
Automation is safer when it starts with current, structured input. A workflow can choose target devices by known facts, check conditions, get useful state, and compare the result after a change. Raw CLI text can remain available for review, while fields become the input used by code.
In addition, a REST API separates data collection from its use. The discovery tool handles device access and parsing. Reports, source-of-truth tools, and automation can then request the records they need.
Source-of-truth sync
Discovery captures observed state. A source of truth often holds intended state. These views relate to each other, but they are not always the same.
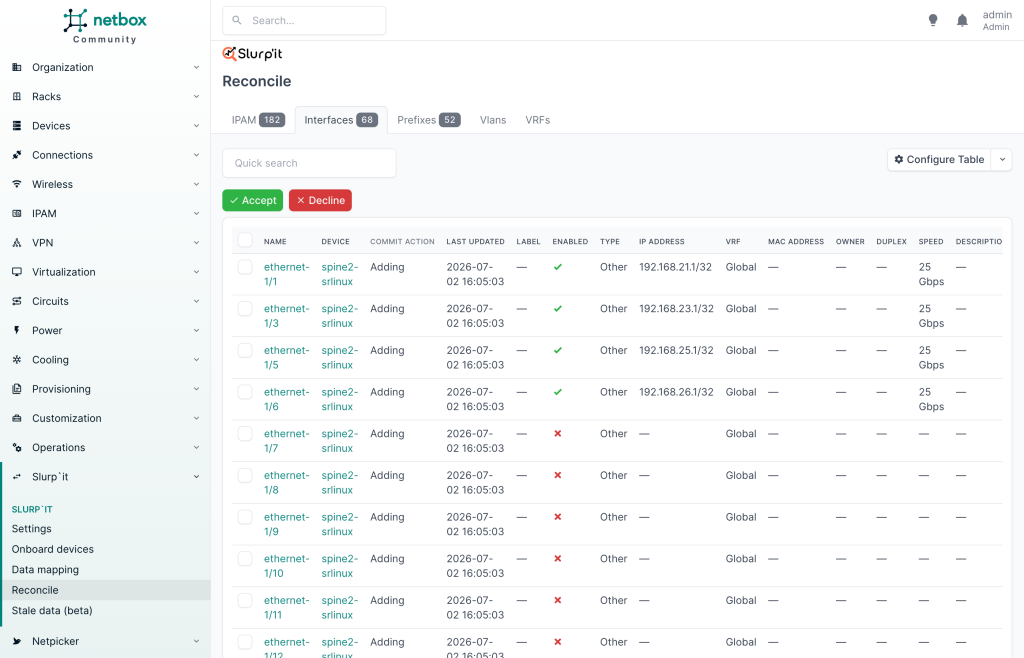
A sound sync process maps fields to the target model, shows differences, and limits which changes may update the source of truth. The open-source Slurp'it NetBox plugin supports onboarding discovered devices, mapping fields, reconciling observed and intended state, and syncing selected changes. See how Slurp'it populates NetBox for the workflow. Slurp'it also supports Nautobot sync.
Seven steps to set up network discovery
- Define the questions. List the inventory, fault finding, topology, and automation questions the project must answer. Do not start with a request to collect everything.
- Map the scope. Note sites, segments, address ranges, access limits, device families, and exclusions. Assign a discovery route for each segmented zone.
- Choose device input methods. Decide where automated SNMP discovery fits and where manual entry, API input, or bulk upload works better.
- Design collection plans. Select commands and fields for each use case. Give fast-changing state a different schedule from slow-changing hardware facts.
- Test parsing and field names. Use sample devices from each key vendor and platform. Check missing values, repeated rows, unusual formats, and stable field names.
- Build links and outputs. Connect devices through interface and neighbor data. Build reports and API outputs for real work, not for show.
- Run the inventory as a product. Track failed discovery, login errors, parse errors, stale records, duplicate devices, and sync conflicts. Review coverage when sites or platforms change.
Practical network discovery checklist
- The scope includes each intended site and network segment.
- Excluded ranges and zones that cannot be reached are recorded.
- Device input uses the right mix of automated discovery, API, bulk upload, and manual entry.
- Credentials grant only the access needed to collect data.
- Each field supports inventory, fault finding, topology, reporting, or automation.
- Update rates reflect how fast each dataset changes.
- Each record includes a collection time or freshness flag.
- Templates are tested against sample vendor and platform output.
- Field names stay stable across vendors where teams need to compare them.
- Neighbor and interface data create useful device links.
- Past collections are kept when change review matters.
- Reports and exports have named users and clear jobs.
- API users have defined fields, filters, and error handling.
- NetBox or Nautobot sync keeps observed state apart from intended state.
- Failed discovery, collection, and parsing are reviewed.
- Stale and duplicate records have a clear cleanup process.
Network discovery mistakes that reduce value
Stopping after the IP scan
An address proves that something replied. However, it does not give enough identity, state, or link context for a trusted inventory. Follow device finding with secure collection and parsing.
Collecting data without a model
A store full of unrelated command results is still hard to use. Therefore, define device identity, field names, times, and links before you add more commands.
Using one schedule for every command
One schedule ignores different rates of change. Instead, separate slow-changing hardware facts from live state that needs more frequent updates.
Ignoring gaps in coverage
Access rules, network segments, unknown output, and login failures can create hidden gaps. Therefore, show coverage and freshness with the inventory.
Syncing every field at once
Observed data may be incomplete, short-lived, or mapped to the wrong field. First, reconcile fields. Then allow selected discovery data to change an intended-state system.
Frequently asked questions
No. Slurp'it collects over SSH, Telnet, SNMP and vendor APIs without installing anything on the devices. SNMP is used for automated device finding; the detailed inventory comes from CLI output parsed with TextFSM templates.
SNMP can help find and identify devices. However, a useful inventory often needs richer live data. CLI collection and parsing can add interfaces, neighbors, routes, VLANs, software, hardware, and other fields needed by the team.
Set the rate by dataset and business need. Slow-changing identity and hardware facts may need fewer runs than interface, neighbor, or route data. Also, show when each result was collected so users can judge its age.
Discovery records observed network state. A source of truth holds the intended model used by the team. Therefore, sync should map and reconcile the two rather than let every observed value replace intent.
Test sample segments, vendors, platforms, and command outputs. Confirm that devices are reachable, needed fields parse in the same way, links are useful, schedules keep data fresh, and reports or API results answer the questions set at the start.
The measure of network discovery is not the number of addresses a scan returns. Instead, ask whether engineers can trust the data when they need to locate equipment, understand a path, compare a change, fill a source of truth, or start automation.
Begin with a clear scope and a small set of work questions. Then connect device discovery to planned CLI collection, parsing, standard fields, relationships, history, and controlled output. To test that flow, use the Slurp'it getting started options to explore training, a sandbox, documentation, or a deployment path.